
Working with Datasets using R
Overview
R is a powerful programming language for statistical computing, and is commonly used among scientists for anything from simple plot generation to interactive applications. Benchling Analyses allow users to generate datesets from the scientific data in Benchling, as well as importing / exporting these datasets to external tools for processing. Using the Analyses API, it’s possible to create R applications that can export datasets, perform complex analysis on scientific data, and seamlessly upload the results back to Benchling.
This guide walks through a basic example of working with Benchling datasets using scripts written in R. The example is a IC50 analysis on Cell Mortality data exported from the Benchling registry; the resulting data and plots are then imported to Benchling and visible as an analysis output. The code used in this guide can be found in this public github repository.
What you’ll need:
- Familiarity and an environment to work with R
- Access to Benchling Insights
- A Benchling app
- ~20 minutes
Setup & Configuration
It’s important to note that this sample code will not function entirely out of the box; the code provided was created as an example to demonstrate a solution to a common use case. There are a few required configuration steps before you can use this sample code with your tenant:
- Benchling app - You’ll need to create a Benchling app in order to generate credentials before interacting with the API. If you’re not familiar with creating Benchling apps, the Getting Started guide is the best place to start.
- Script configuration - The sample code requires some tenant specific variables to function; you’ll need to update the scripts in places to include values from your own tenant. These variables are clearly marked in the code with comments denoting
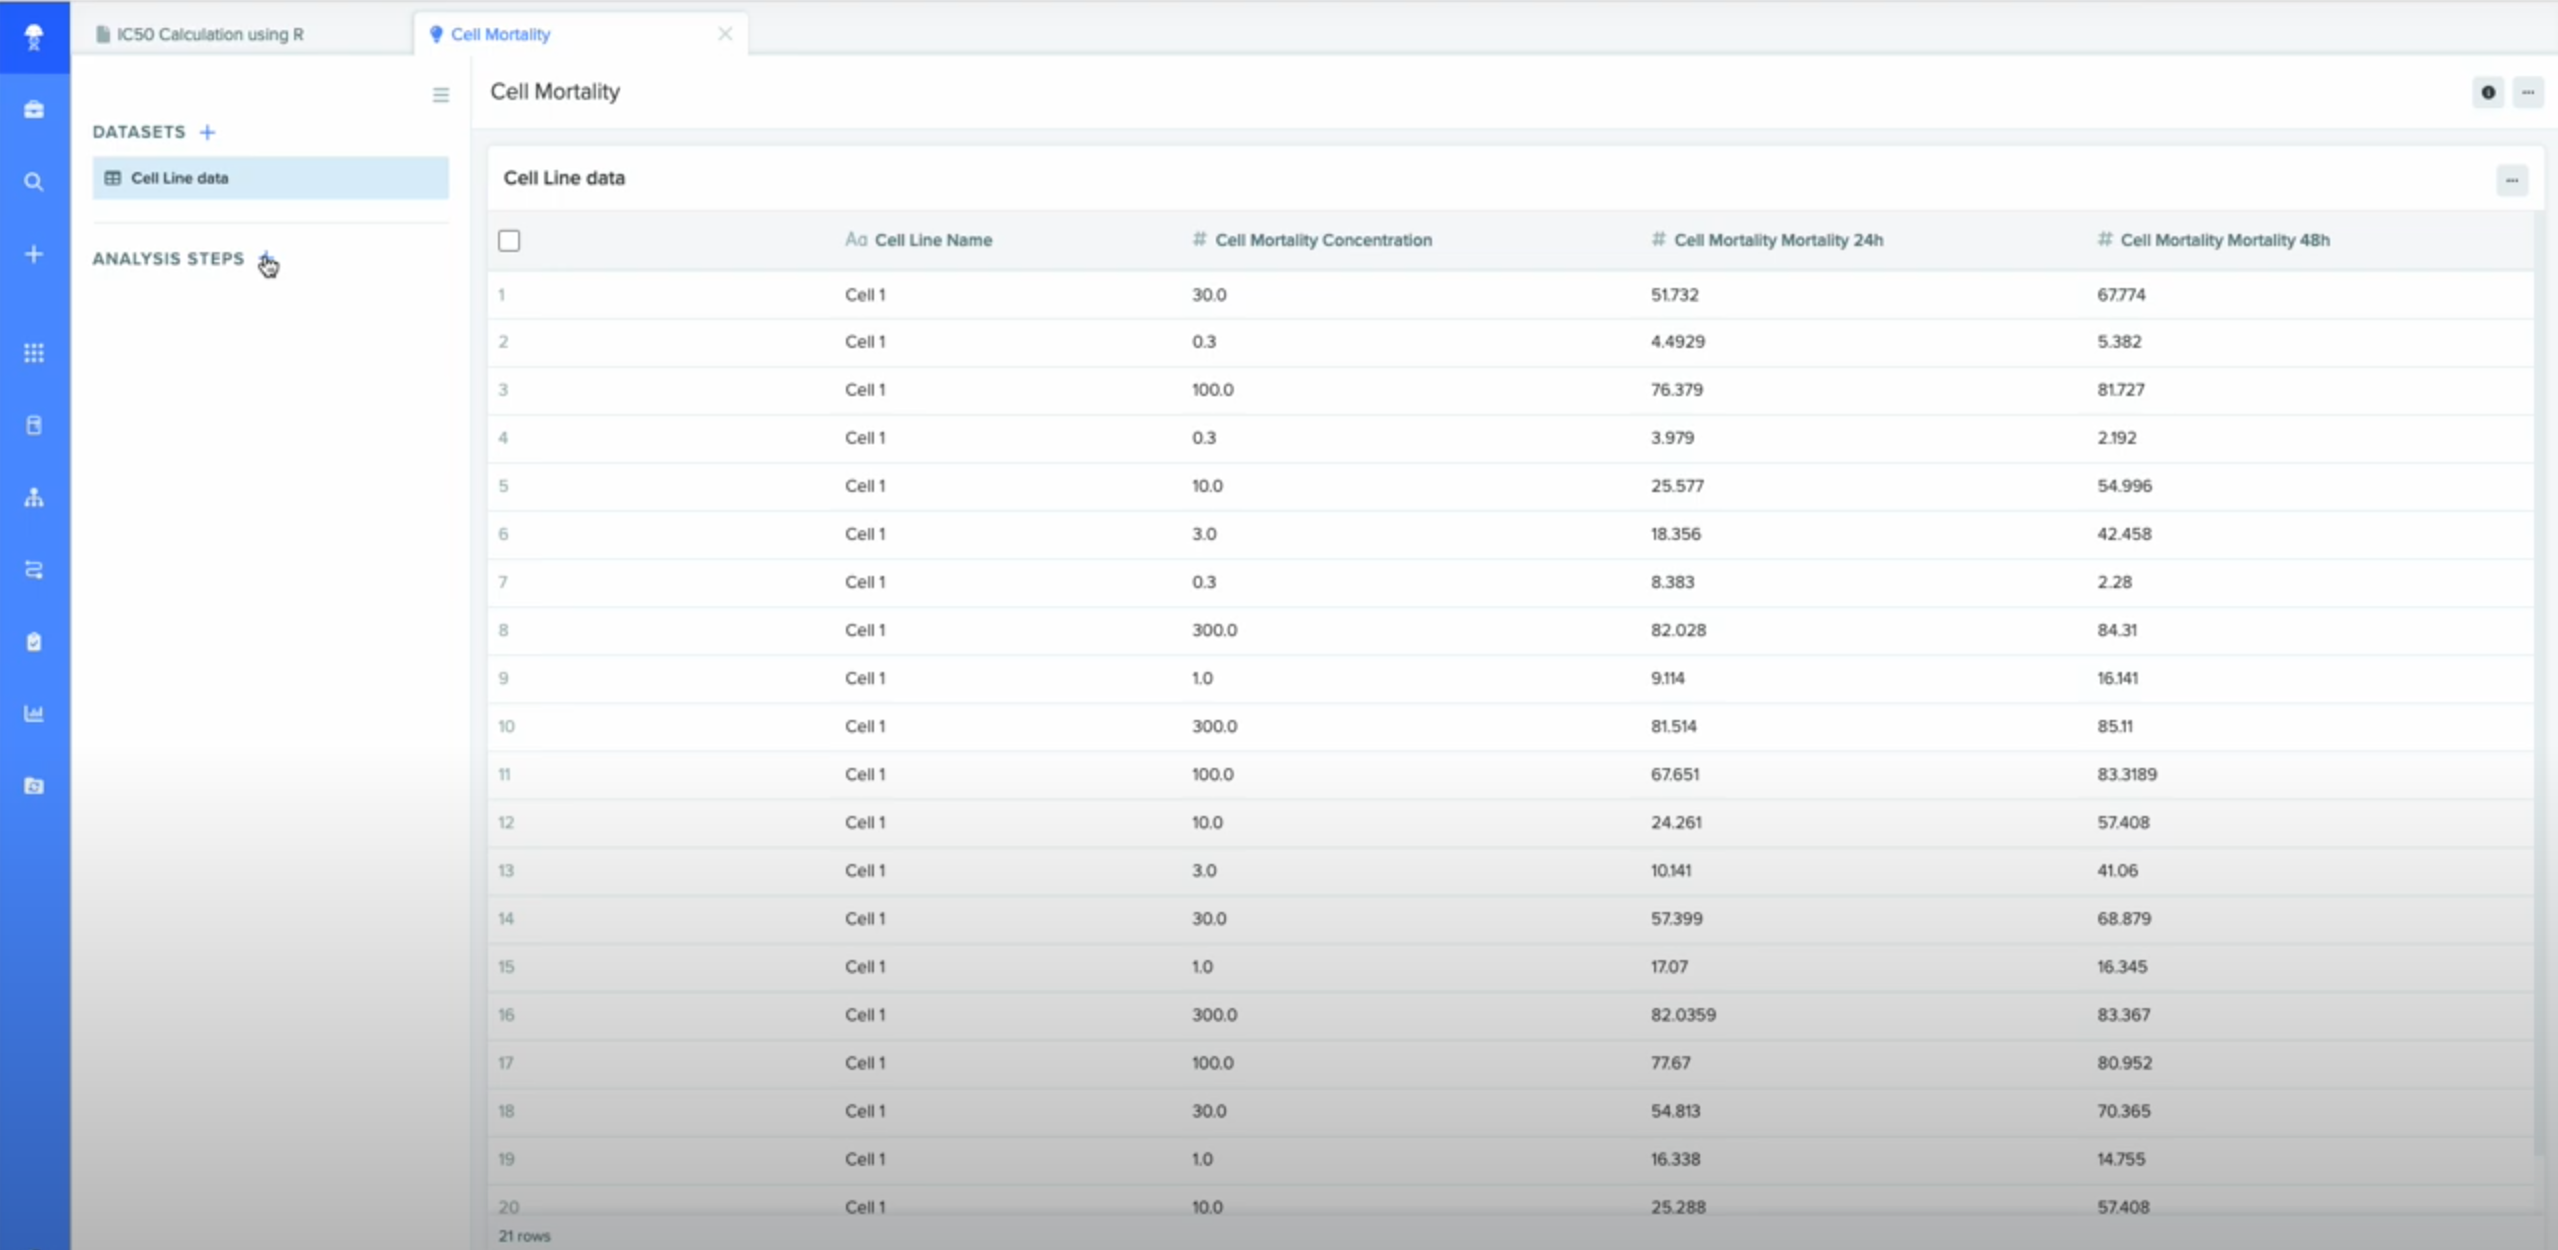
# INPUTfor searchability. - Analysis with Dataset- In order to pull/push data to an analysis in Benchling, an analysis must be created. An analysis consists of two parts: A starting dataset, and at least one analysis step. While the specifics will vary from customer to customer, this sample code assumes there’s a starting dataset created from registry data, containing at least two columns: ‘Cell Concentration’ and ‘Cell Mortality’.
A visual of this data being created from a registration table is included below. The Benchling Help Center and Analyses API Developer Guide are great resources for working with analyses in Benchling.
Getting Started
The sample code provided includes a number of different files:
get_dataframe.R- A script that downloads a dataset from Benchling and converts it to an R dataframeresult_analysis.R- A script that performs an IC50 calculation, then uploads the result to the output of a Benchling analysisMortality IC50.xlsx- A CSV including the relevant columns and sample data
Working with the sample code requires some configuration in Benchling (see Setup & Configuration). Once that configuration is complete, you should have an analysis that looks something like this:
From here we can add an import/export analysis step, which is how our scripts will interact with Benchling. Add an import/export step and then copy the analysis step key, which is used by the scripts:
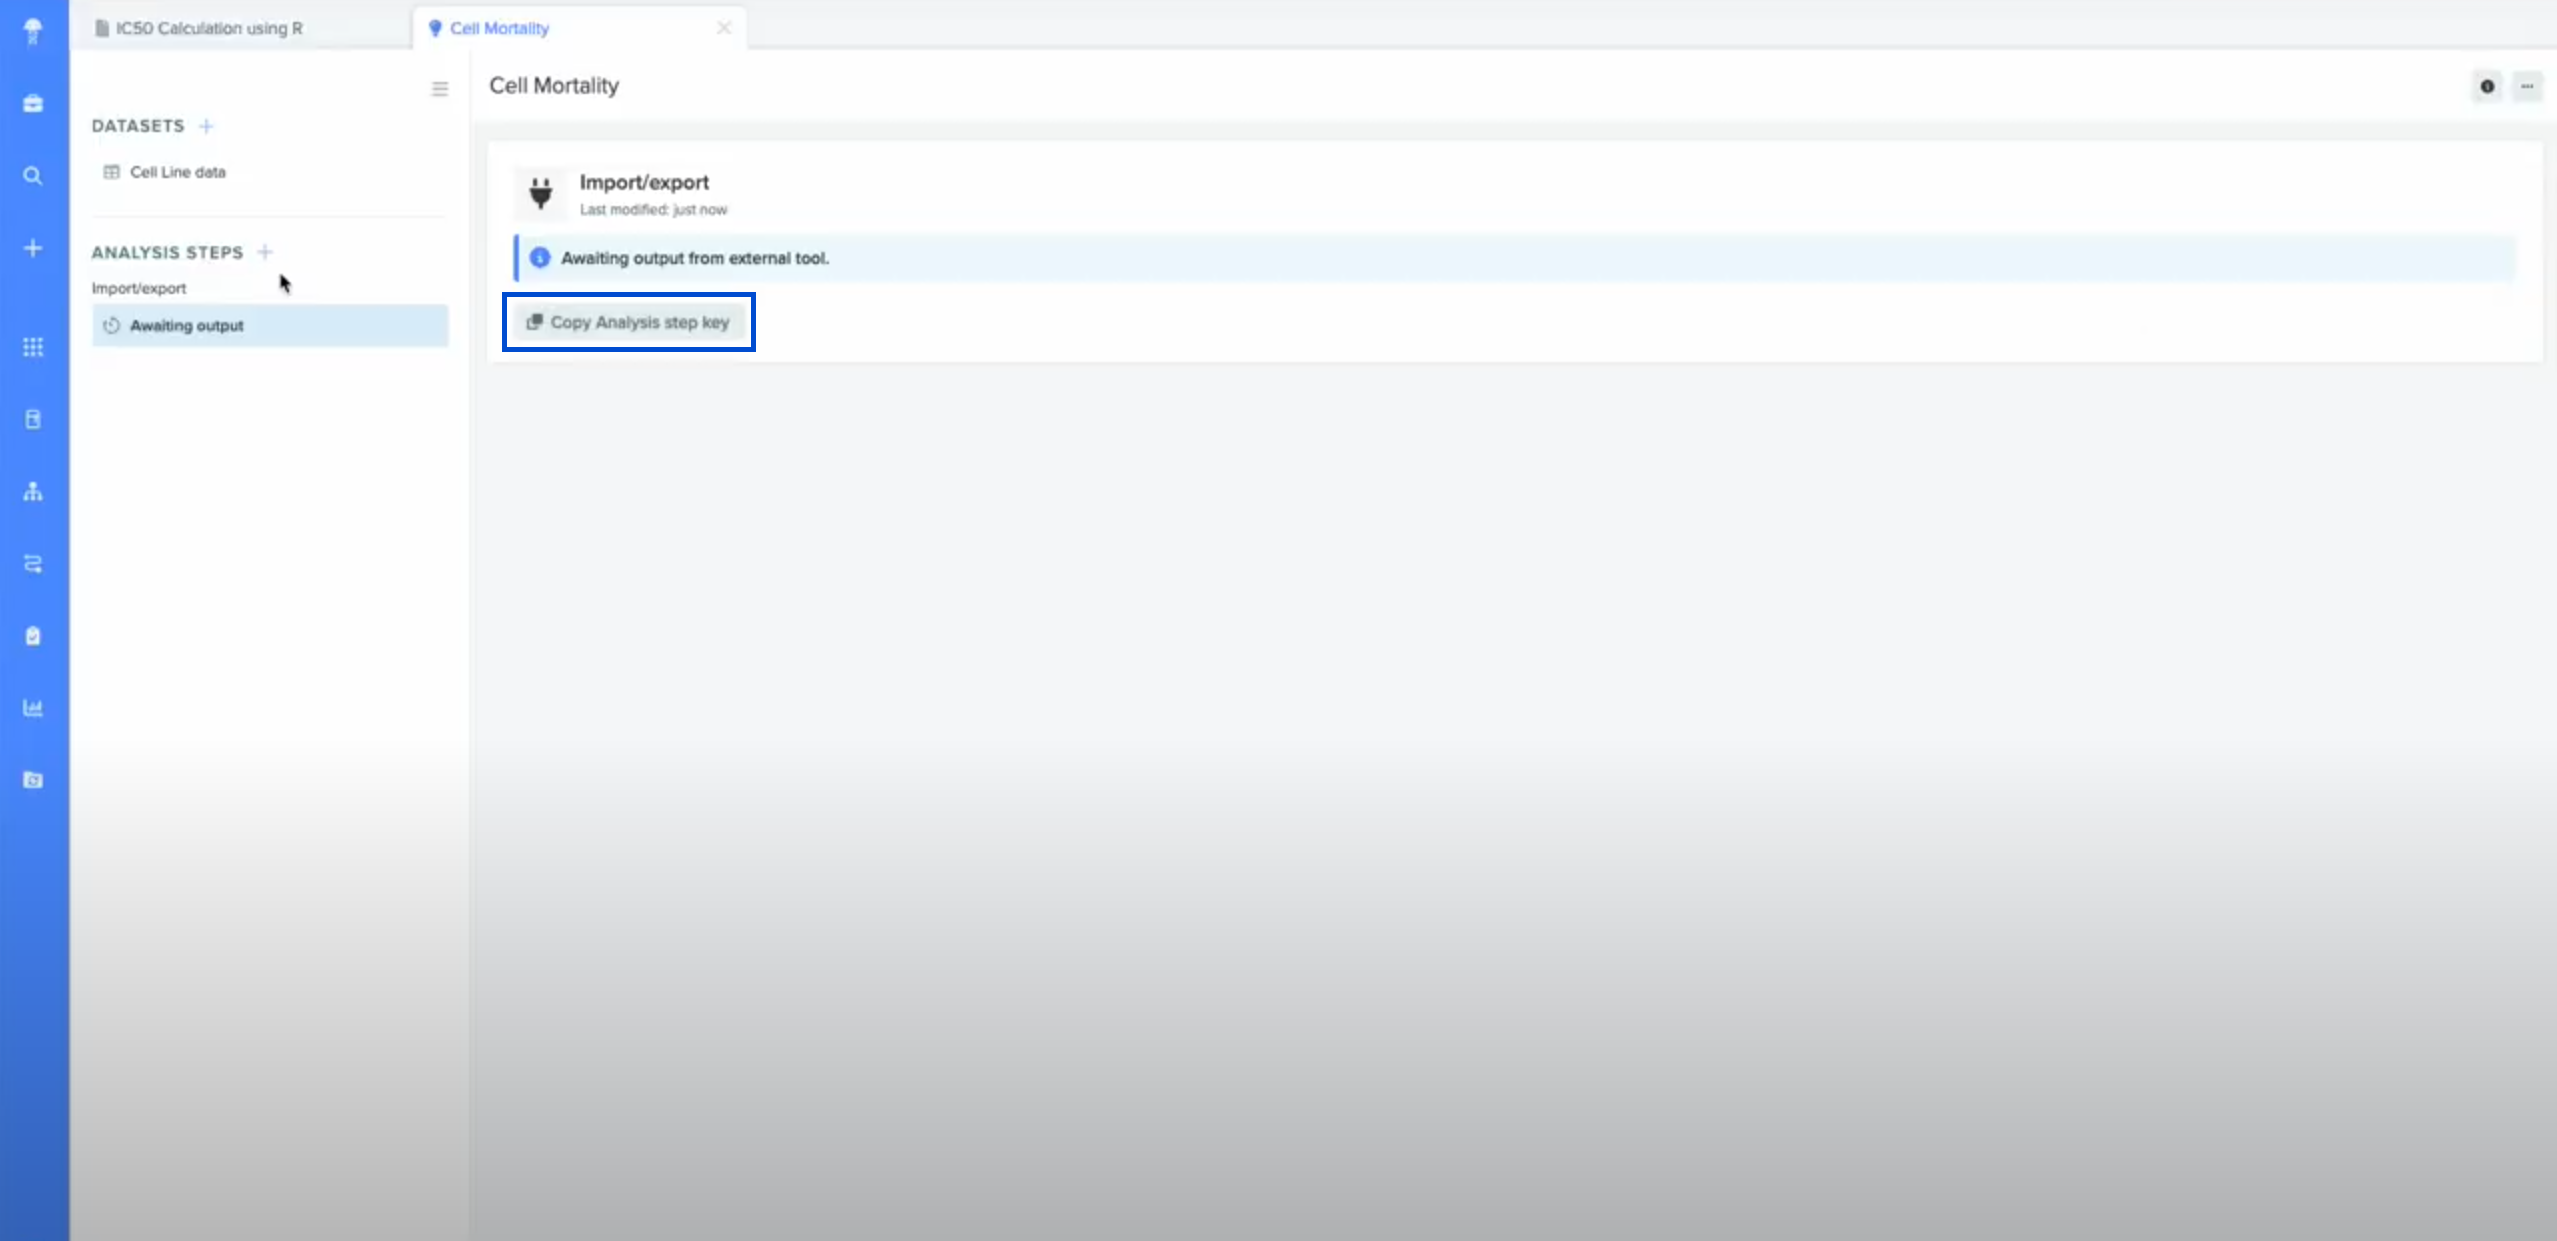
With an analysis created and analysis step key in hand, you’re ready to work with any of the example scripts. Below is a description of what is required when using each script, as well as an overview of how they operate:
get_dataframe.R
get_dataframe.Rget_dataframe.R requires the following values: Your app’s client_id and client_secret, as well as the analysis step key obtained in the previous step. These values are required in the code denoted by an # INPUT comment; replace the placeholder value for these variables with the values obtained from your tenant.
This script generates outputs by pulling the input dataset from your analysis in Benchling and converting it to an R dataframe. This script is doing a number of things, but we can consider three major steps:
- Authentication - The first half of the script involves using the app
client_idandclient_secretto generate an access token, as well as breaking the step key into parts to obtain your tenant subdomain and analysis step ID. This information is crucial to importing/exporting data to/from Benchling - Querying the analysis - The next quarter of the script involves querying the import/export step to obtain the API ID of the input dataset. Importantly, this script assumes there is only a single dataset.
- Exporting the dataset - The final quarter of the script uses the dataset API ID to export the dataset from Benchling, saving it as an R dataframe.
results_analysis.R
results_analysis.Rresults_analysis.R requires similar values as get_dataset.R, but unlike the previous script it also requires an existing R dataframe. It is recommended to runget_dataset.R first, then run results.analysis.R directly after. Running these scripts sequentially allows you to use the dataframe output from get_dataset.R as the input to results_analysis.R.
There’s a bit more going on in this script; it involves processing the dataframe, generating the relevant outputs (a CSV and an HTML plot), and interacting with the Analyses API to upload the outputs to your analysis:
- Calculating IC50 - The first portion of the script is where the “magic” happens. Using standard libraries and a 4 parameter log-logistics model, the script calculates a slope and IC50 value from the input dataset. The analysis is then saved locally in a CSV file in preparation for subsequent steps.
While most of the sample code is dedicated to interacting with the Benchling API, here is where actual data processing occurs. While you’ll be writing very similar code to interact with Benchling when building your own integrations, this is where you’ll likely be doing very different things. Consider how you can build on what you learn here to create robust, reusable integrations in the future!
- Uploading Output Dataset - The IC50 data created in the previous step must be uploaded to Benchling in order to be converted into an Output dataset on your analysis. The script creates a binary from the CSV, and queries the datasets API to obtain an S3 upload URL. After uploading the binary to the S3 upload URL, the script sets the step’s dataset’s status to
IN_PROGRESSto communicate to users in Benchling that the analysis is ongoing. - Generating and Uploading Output Plot - Using the plotly library, a scatter plot is created from the IC50 data. Benchling analyses support a number of file types; here the script is creating an
.htmlfile to visually represent the data. Similar to the previous step, a binary is created from the file in preparation for upload. Unlike datasets, this kind of visual data is uploaded using the Files API; similar to datasets, this involves querying the API and obtaining an S3 upload url. - Importing Outputs to Analysis - Last but not least, the uploaded dataset and plot must be imported to the analysis as outputs. This involves creating a JSON request body including the dataset and file IDs obtained after uploading.
Outputs
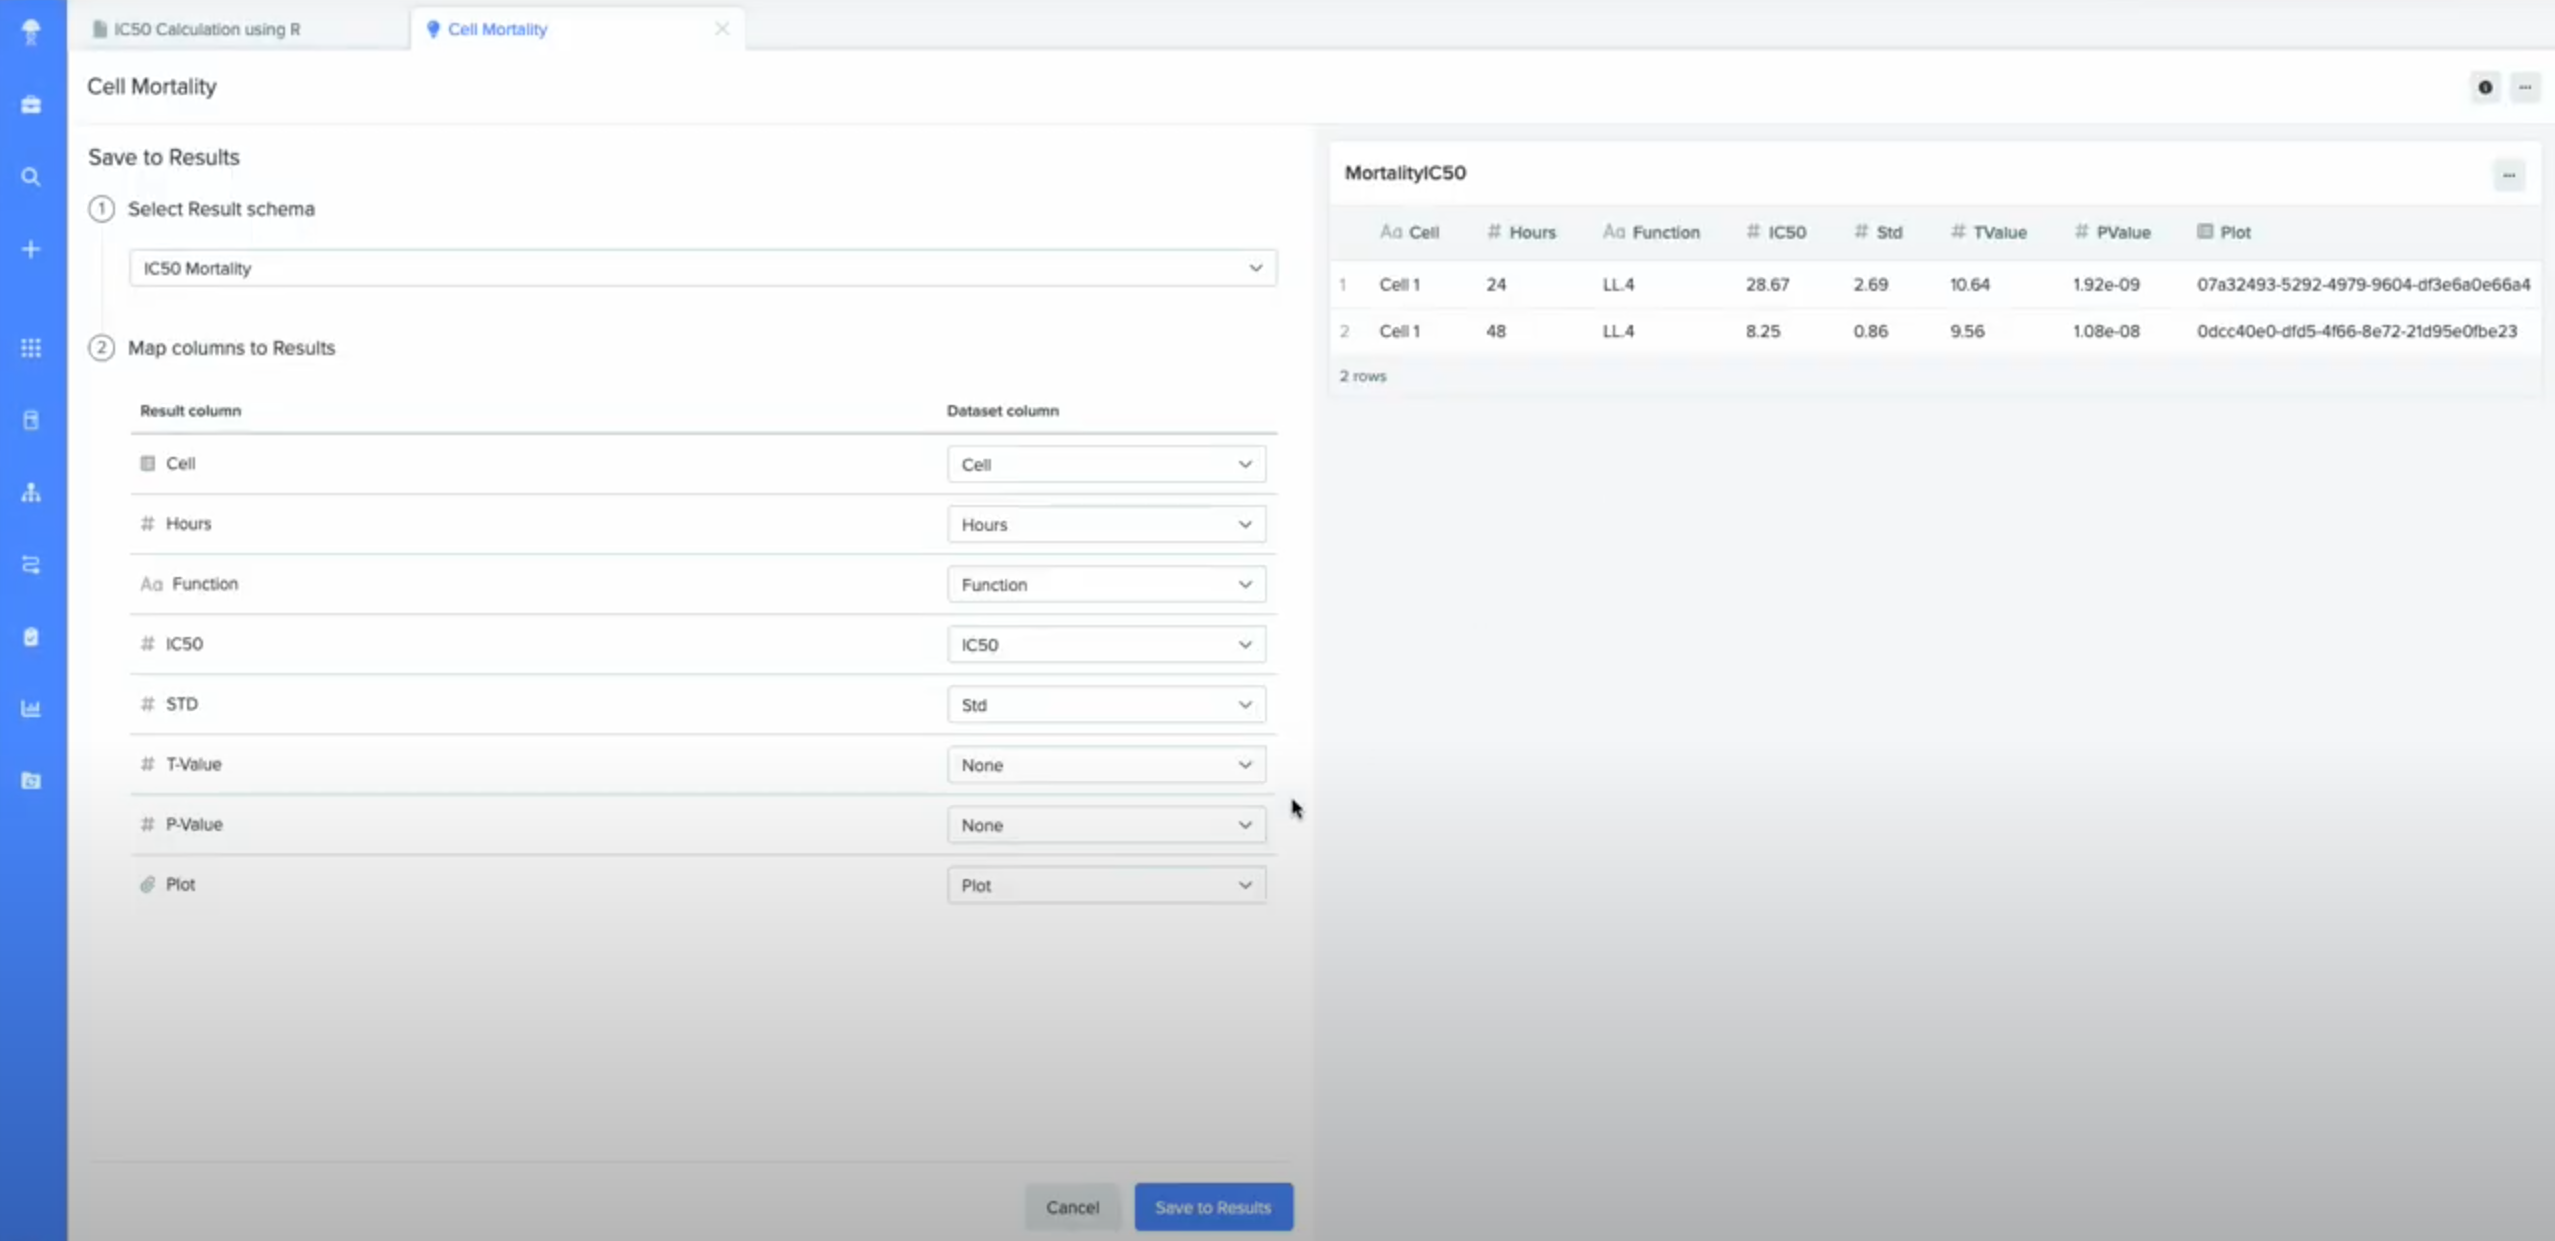
With our analysis complete and our outputs uploaded to Benchling, we can see our data appearing in the output of our import/export step:
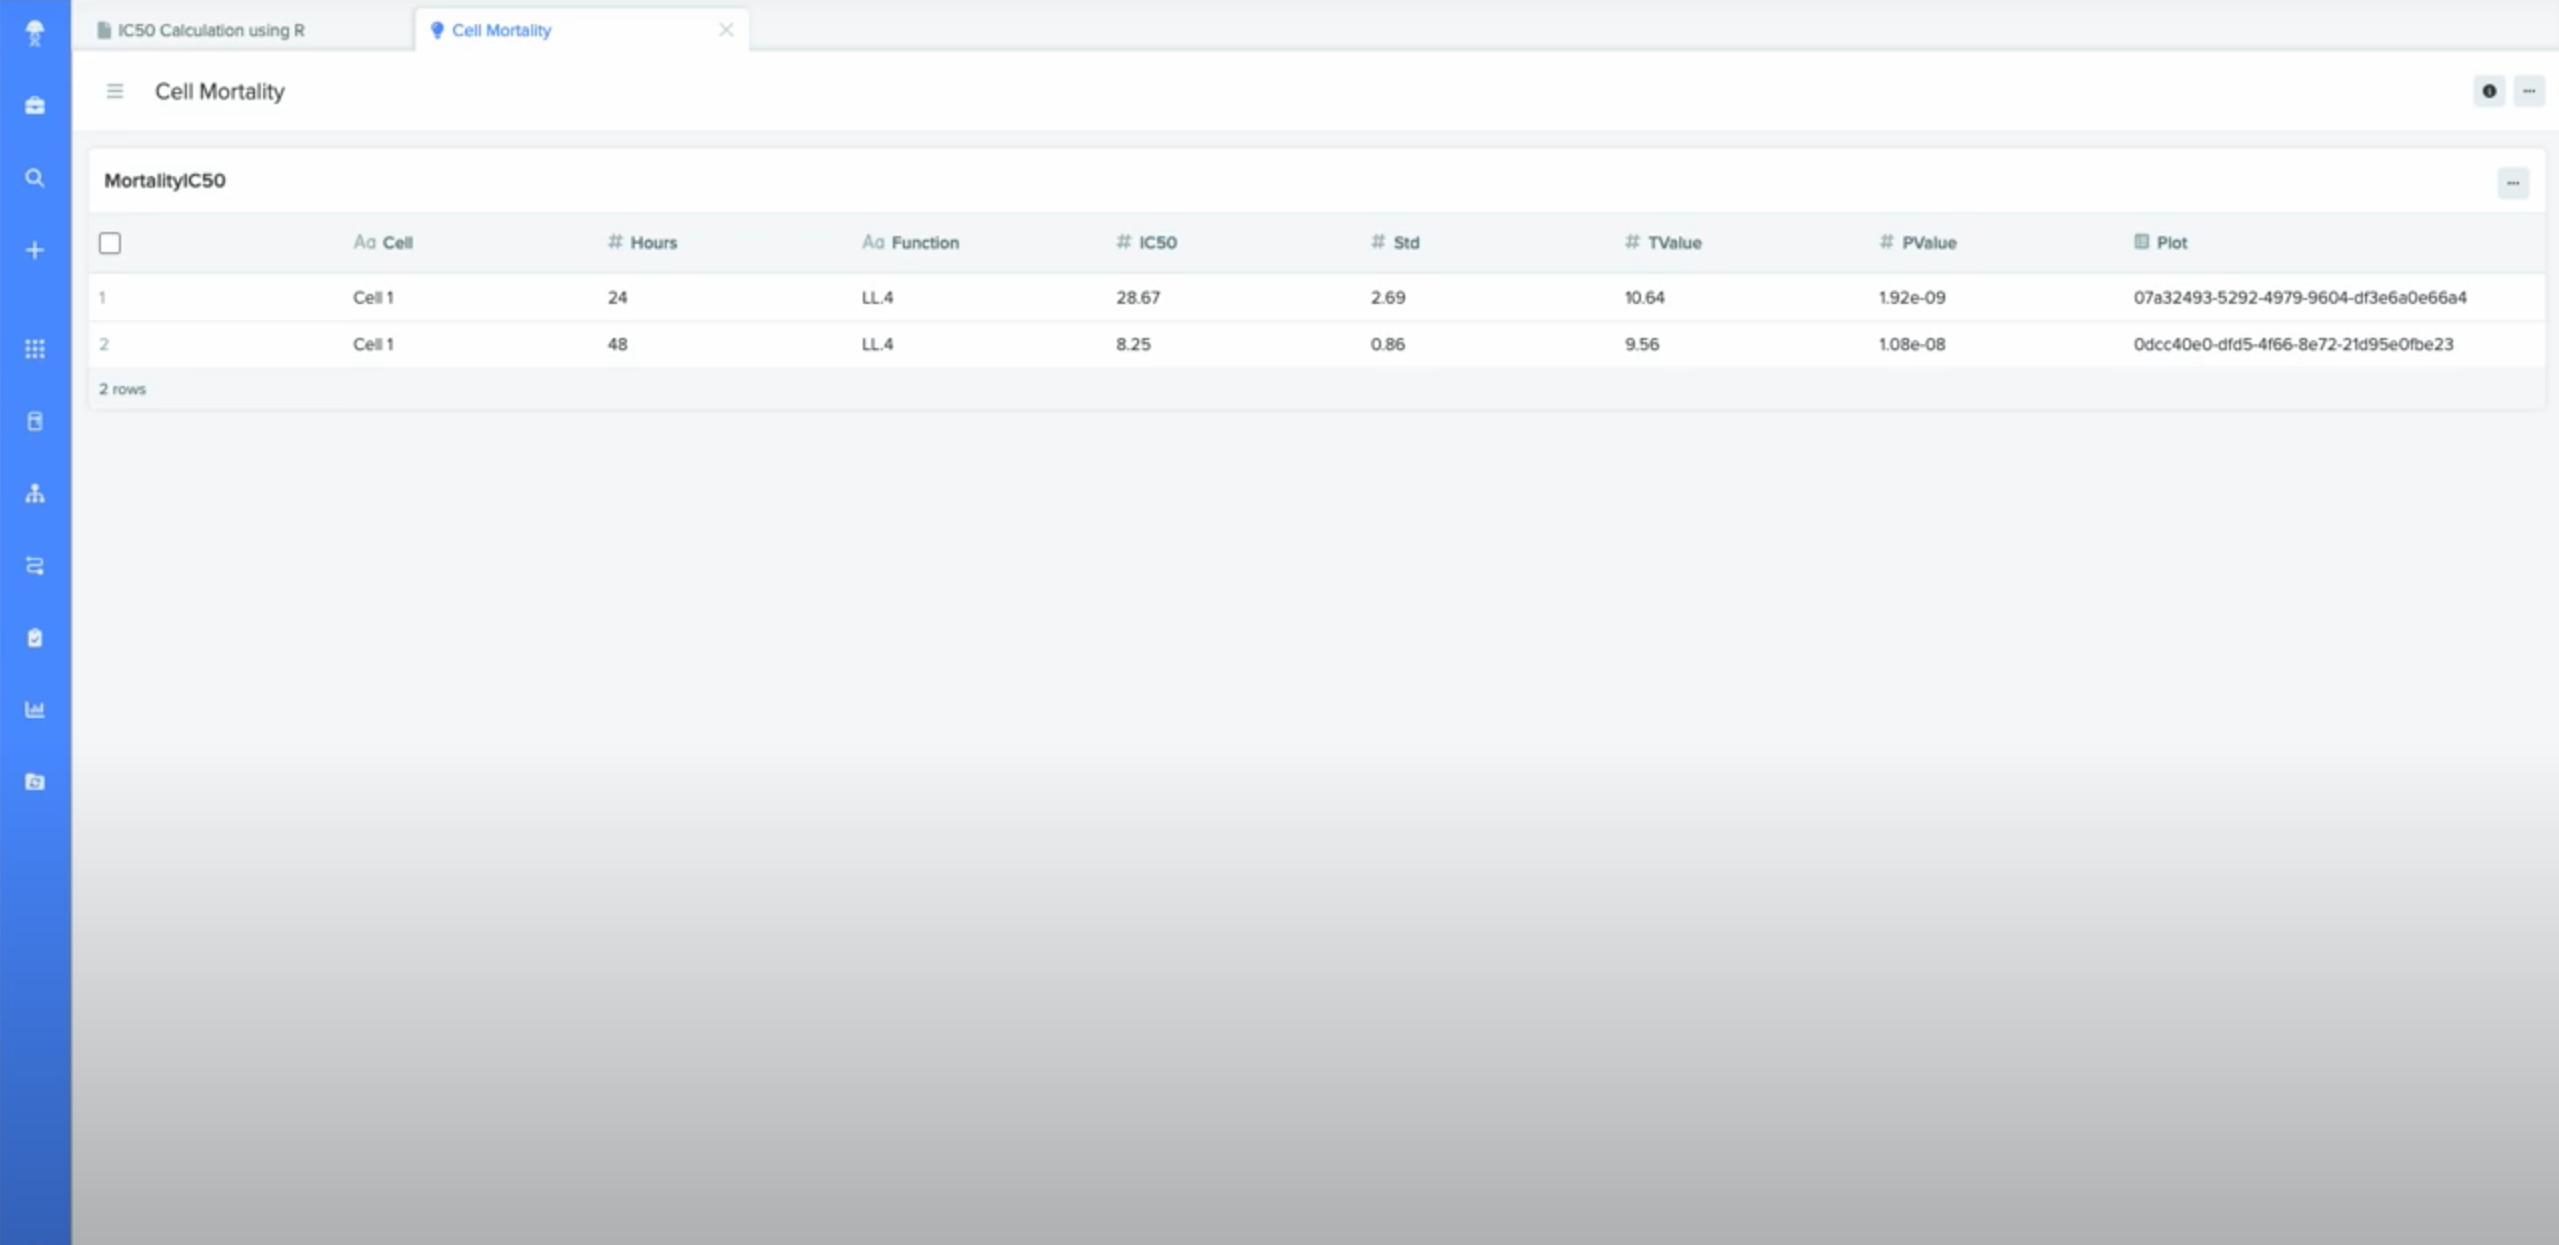
This tabular data can be saved to results:
Finally, we can view our mortality plots under Files:
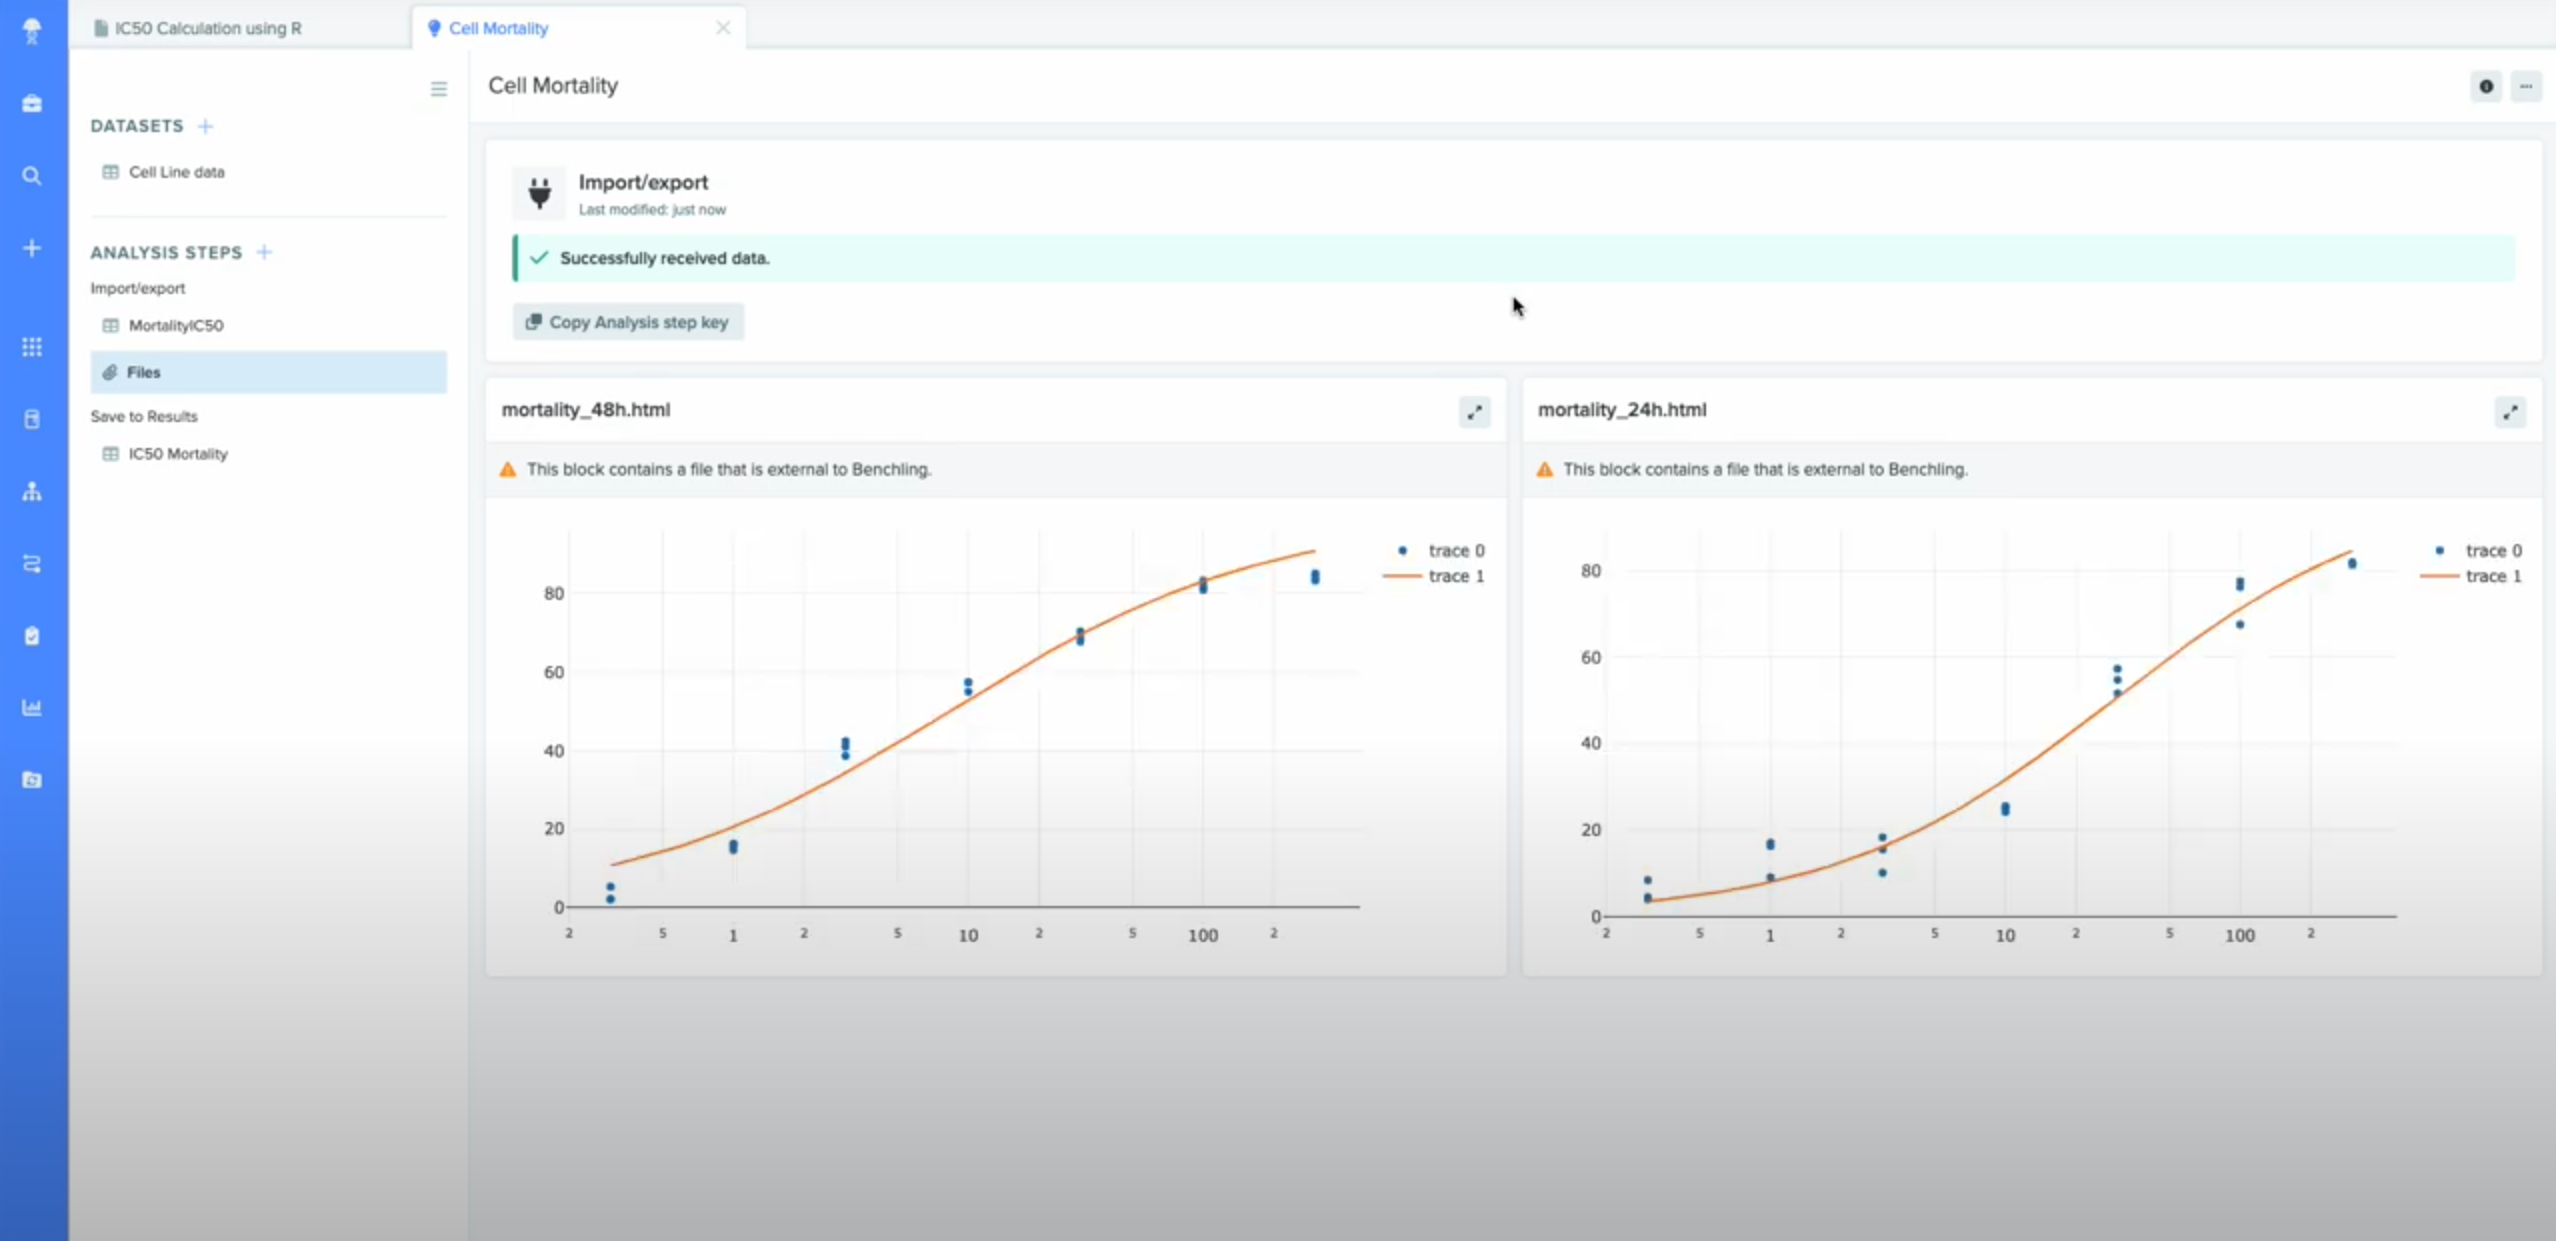
At which point our analysis is complete!
Conclusion
Working with a Benchling analysis, we were able to create a dataset from scientific data in the Registry and perform an IC50 calculation on it using an external R script. What’s more, we could then upload the outputs back into our analysis, both as a dataset and a visual plot showing our results.
These same principles can be applied to more sophisticated integrations: Running more complex analysis on data, integrating with 3rd party analysis tools, and building user interface applications using R shiny are all possible leveraging Benchling analyses.
Updated over 1 year ago